This blog post entry was written by CLIR CCEPS Fellow, Lilyan Rock:
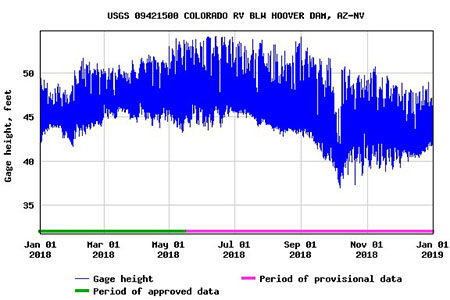
River courses, after carving through the Earth like how the Colorado has done to the Grand Canyon, don’t change coordinates within the span of a century. They can, however, change flow and rate, either naturally or synthetically through the construction of dams and irrigation maneuvering. Environmental historians may find charts such as this one below, worth more than just the values of their numbers.
When measuring the effects of water management on an environment it is important to consider the previously recorded flow of a river, versus the current recorded outputs from today. Not only do environmental historians have to work with scientifically recorded data, to glean said data they must keep up with the changing technologies over the years as well.
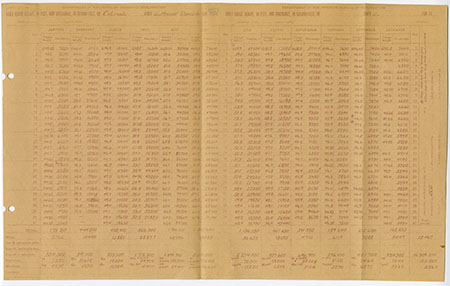
This image above is part of the Boulder Canyon Projects series, charting the average flow between January to December of 1932 at the location of modern day’s Hoover Dam. The chart below is from Hoover Dam’s flow between January to December of 2018.