Beginning the week with a small trip back to the photo lab, I had the opportunity to start learning about how to use content.dm, which was interesting. While working on the descriptions of the materials that were digitized, I had to read through them in order to find out a proper way to condense the information. Some of the materials were an eye-opener into the way negotiations were made between Willis S. Jones and the owners of lands across the Los Angeles County through which some of the major pipelines and pumping plants were built.
An Unusual Turn
Digitization of the Willis S. Jones papers took a rather unusual turn this week as it consisted of a mixture of different types of archival materials such as sketch maps, weather reports, pump level notes, installation calculations, a few letters and reports. Few of the most interesting materials to work on were the pump level notes that consisted of calculations of horsepower, boost, lift, water elevation, transmission and gravity. Weather reports mainly consisted of rainfall measurements in different stations across the Los Angeles and Riverside County over different seasons leading to the calculations of the running hours of the pumps.
An interesting item was the sketch map of a ‘portable derrick’ that was used for building of the pumping plants and pipelines. Another vital piece of information were the letters that were exchanged between Willis S. Jones and the Vail Company during the process of the building of the plants and pipelines. One could notice that many re-negotiations had taken place before the decisions on the rates were made. Additionally, the rainfall of each season played a crucial role in determining the rates of that particular season.
New Discoveries!
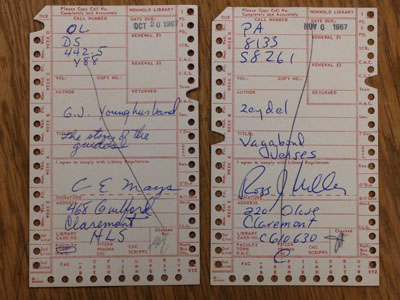
This week, I came across two library cards from the Honnold-Mudd Library dated back to 1967! Considering the technological developments that have taken place around us, it was fascinating to see an old library card, where the borrower had to mention everything on paper, every time they borrowed a book. Looking closely, one could see the mention of the Claremont Colleges from which the borrower had to choose. Being a Claremont Graduate University (CGU) student, it was interesting to learn that CGU used to be named as the Claremont Graduate School (as mentioned in the card).
Coming back to the digitization project, this week I worked on materials by Willis S. Jones that focused solely on building of pipelines and pumping plants. Going through the materials, I was able to understand that the process consisted of preparing examination reports of the regions, drawing sketch maps of the plants and pipelines, checking reports from the Los Angeles County Flood Control District and preparing reports of rainfall and discharge measurements along with the required mathematical calculations.
Back to Base!
One of the elements that played a key role in determining water supply to a majority of the cities in California between 1918 and 1930 was the distribution of water that was conserved from rainfall. Digitizing rainfall records from various places such as Santa Rosa, the Tenaja Station, the Pauba Ranch and the Nigger Canyon gave me a perspective on how water was distributed to various parts of California based on the regions’ seasonal rainfall. Regions with higher rainfall records would get lesser supply over a year compared to ones where the weather was mostly dry. Letters sent between the Los Angeles Chamber of Commerce and Willis S. Jones was an eye-opener as to how the prices were negotiated.
Lights, Camera and more..
In my second week as a CCEPS fellow, I got involved in digitization of over-sized archival items. This involved taking photographs of maps and diagrams. Being an avid photographer, I got the opportunity to use a Hasselblad 300CM camera in order to take pictures of the over-size items. Lighting and using various types of lenses was a key part of the process.
Apart from photography, I continued to work on the Willis S. Jones files, where reports on the Temecula project and well logs that were recorded by Willis S. Jones were digitized. Reports of various wells such as the Murrieta Valley wells and the Pauba Ranch Valley wells were particularly interesting considering the complexity involved in getting the readings accurately. Once the logs were recorded, soil and moisture determination using mathematical formulas were done by Edward S. Babcock & Sons, which was an interesting read.