Not All Who Wander The Archives Are Lost

Hello again everyone!

Today is my last day of work with the CLIR CCEPS project. Since May of this year, I have been working on archival projects related to California’s water history. Having only had brief experience in archival work prior to this project, I appreciated the exposure to this field of work. I have a deeper appreciation for the time, effort, and meticulousness required in managing archives and preparing items for the public to have access to. My work is only a stepping stone towards a future finished digital collection featuring items from different libraries who are working together. 
I first started my experience here at CCEPS by digitizing Boxes 1 & 3 of the Imperial Valley Records. I am actually quite happy to have scanned items relating to the Imperial Valley–I did not previously know much about this area and its history despite traveling through this region a few times. I actually think I may use some of the items dealing with the creation of the Salton Sea for a graduate school paper. So sometimes in this line of work, you may find something in the archives that you can use for your own research. 
After that, I began working on the metadata for these items. Over the course of managing the metadata for over 100 items, I tried to be thorough, specific, and clear. I wanted to make sure that the metadata reflected the reality of the items, so that future patrons will be able to find what they’re interested in with ease. In recent weeks during the Fall semester, I have been consulting the digital libraries and archives of other institutions. As a result, I have been exposed to different “metadata styles.” I saw some metadata that was thorough, and some metadata that could have been more “meaty” in terms of subject terms. In previous entries, I have described my metadata creation thought process. Making sure the correct Library of Congress terms are used was part of my mission. I have tried my best to create metadata that will be most helpful to future patrons but also was produced efficiently. 
In the midst of working on the metadata for my items, I took part in a trip to the Metropolitan Water District with my fellow CLIR CCEPS peers. There, we met with the district’s archivist and learned about how he handles his archives and how he worked with their social media team to advertise exhibits he created. While there, we also saw their two current exhibits he had worked on: “Turning on the Tap: 75 Years of Water Delivery to Southern California,” and “From the Archives Reaching for Water – Rex Brandt and Metropolitan.” Learning about how they handled social media to advertise their 75th anniversary exhibit has helped us at CLIR CCEPS figure out how we should handle social media for the CLIR project. Later, while working on metadata, I realized I had actually scanned one item that relates to the construction of the Colorado River Aqueduct: http://cdm15831.contentdm.oclc.org/cdm/ref/collection/cwd/id/4761 

Since finishing my metadata, I began working on a land ledger from the Ontario City Library. My fellow CLIR CCEPS fellows will soon begin working on metadata for these items and uploading them on behalf of the Ontario City Library. 

The CLIRWater project has given me the opportunity to explore archives from a different perspective, and this experience is one that I will carry with me moving forward in my master’s program at Claremont Graduate University. 

The Wet Letter Book

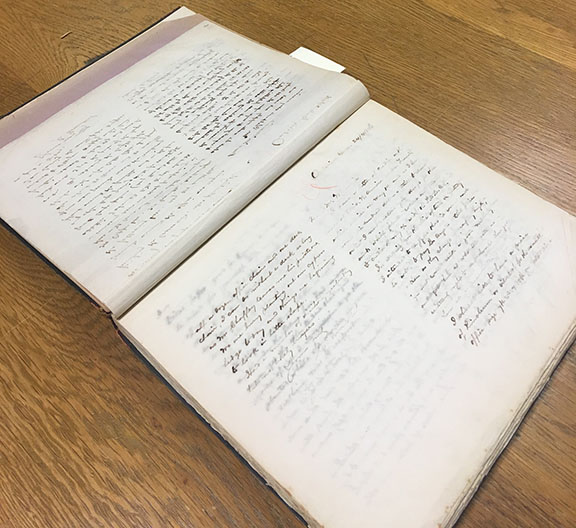
Before the photocopier, companies and businesses had to handwrite copies for their records. By the end of the 19th century, businesses
were using a “copy book” or “wet letter book” which consisted of sometimes a
1000 pages of razor thin tissue paper bound in a hard cover.

How the copy book worked is that the letter to be copied would
be placed under the right-hand page, while the left-hand page would be dampened
with water in order to make the copy.  The
book was then closed and squeezed in a copy or letter press. When the book was
opened, the letter would be taken out to dry and its copy would remain on the
right-hand side of the book. When the Ontario Land & Improvement Co. was
conducting business in the 1880s, the use of such copy books would have been
standard practice in their offices.

whole copy book 2 (adobe 2).jpg

whole copy book (adobe).jpg

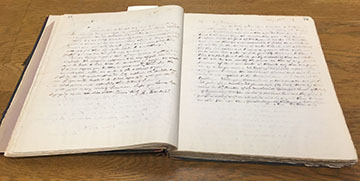
This week, I’ve been scanning the pages of a copy book
consisting of letters written by the Manager of the Ontario Land &
Improvement Co., Charles Frankish. The dates in the copy book range from April
4, 1886 to June 11, 1888, ranging in legibility due to age and perhaps even the quality of the print made by the
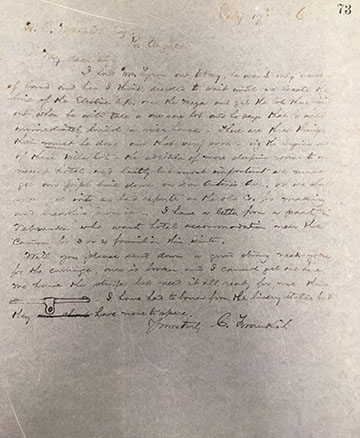
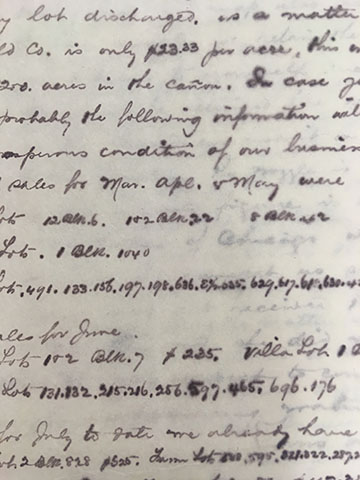
individual making the copies. The ink in some letters is prominent and clear, while
in others it is faded due to natural age or blurred during the copying process.
 

It’s interesting to think about how the technology used to
make the copies in the copy book were made with technology that was just as
innovative as the book scanner I’m using to make digital copies of that 19th
century wet letter copy book.  How will
we be making copies of our digital copies 150 years from now?

Below are photographs of individual letters from the
Frankish wet letter book.

letter with image (adobe for post).jpg

close-up of opy book (adobe).jpg

Ontario: Then and Now

Anyone who has read my past blog posts knows that one of my
biggest priorities with this project is making information accessible to
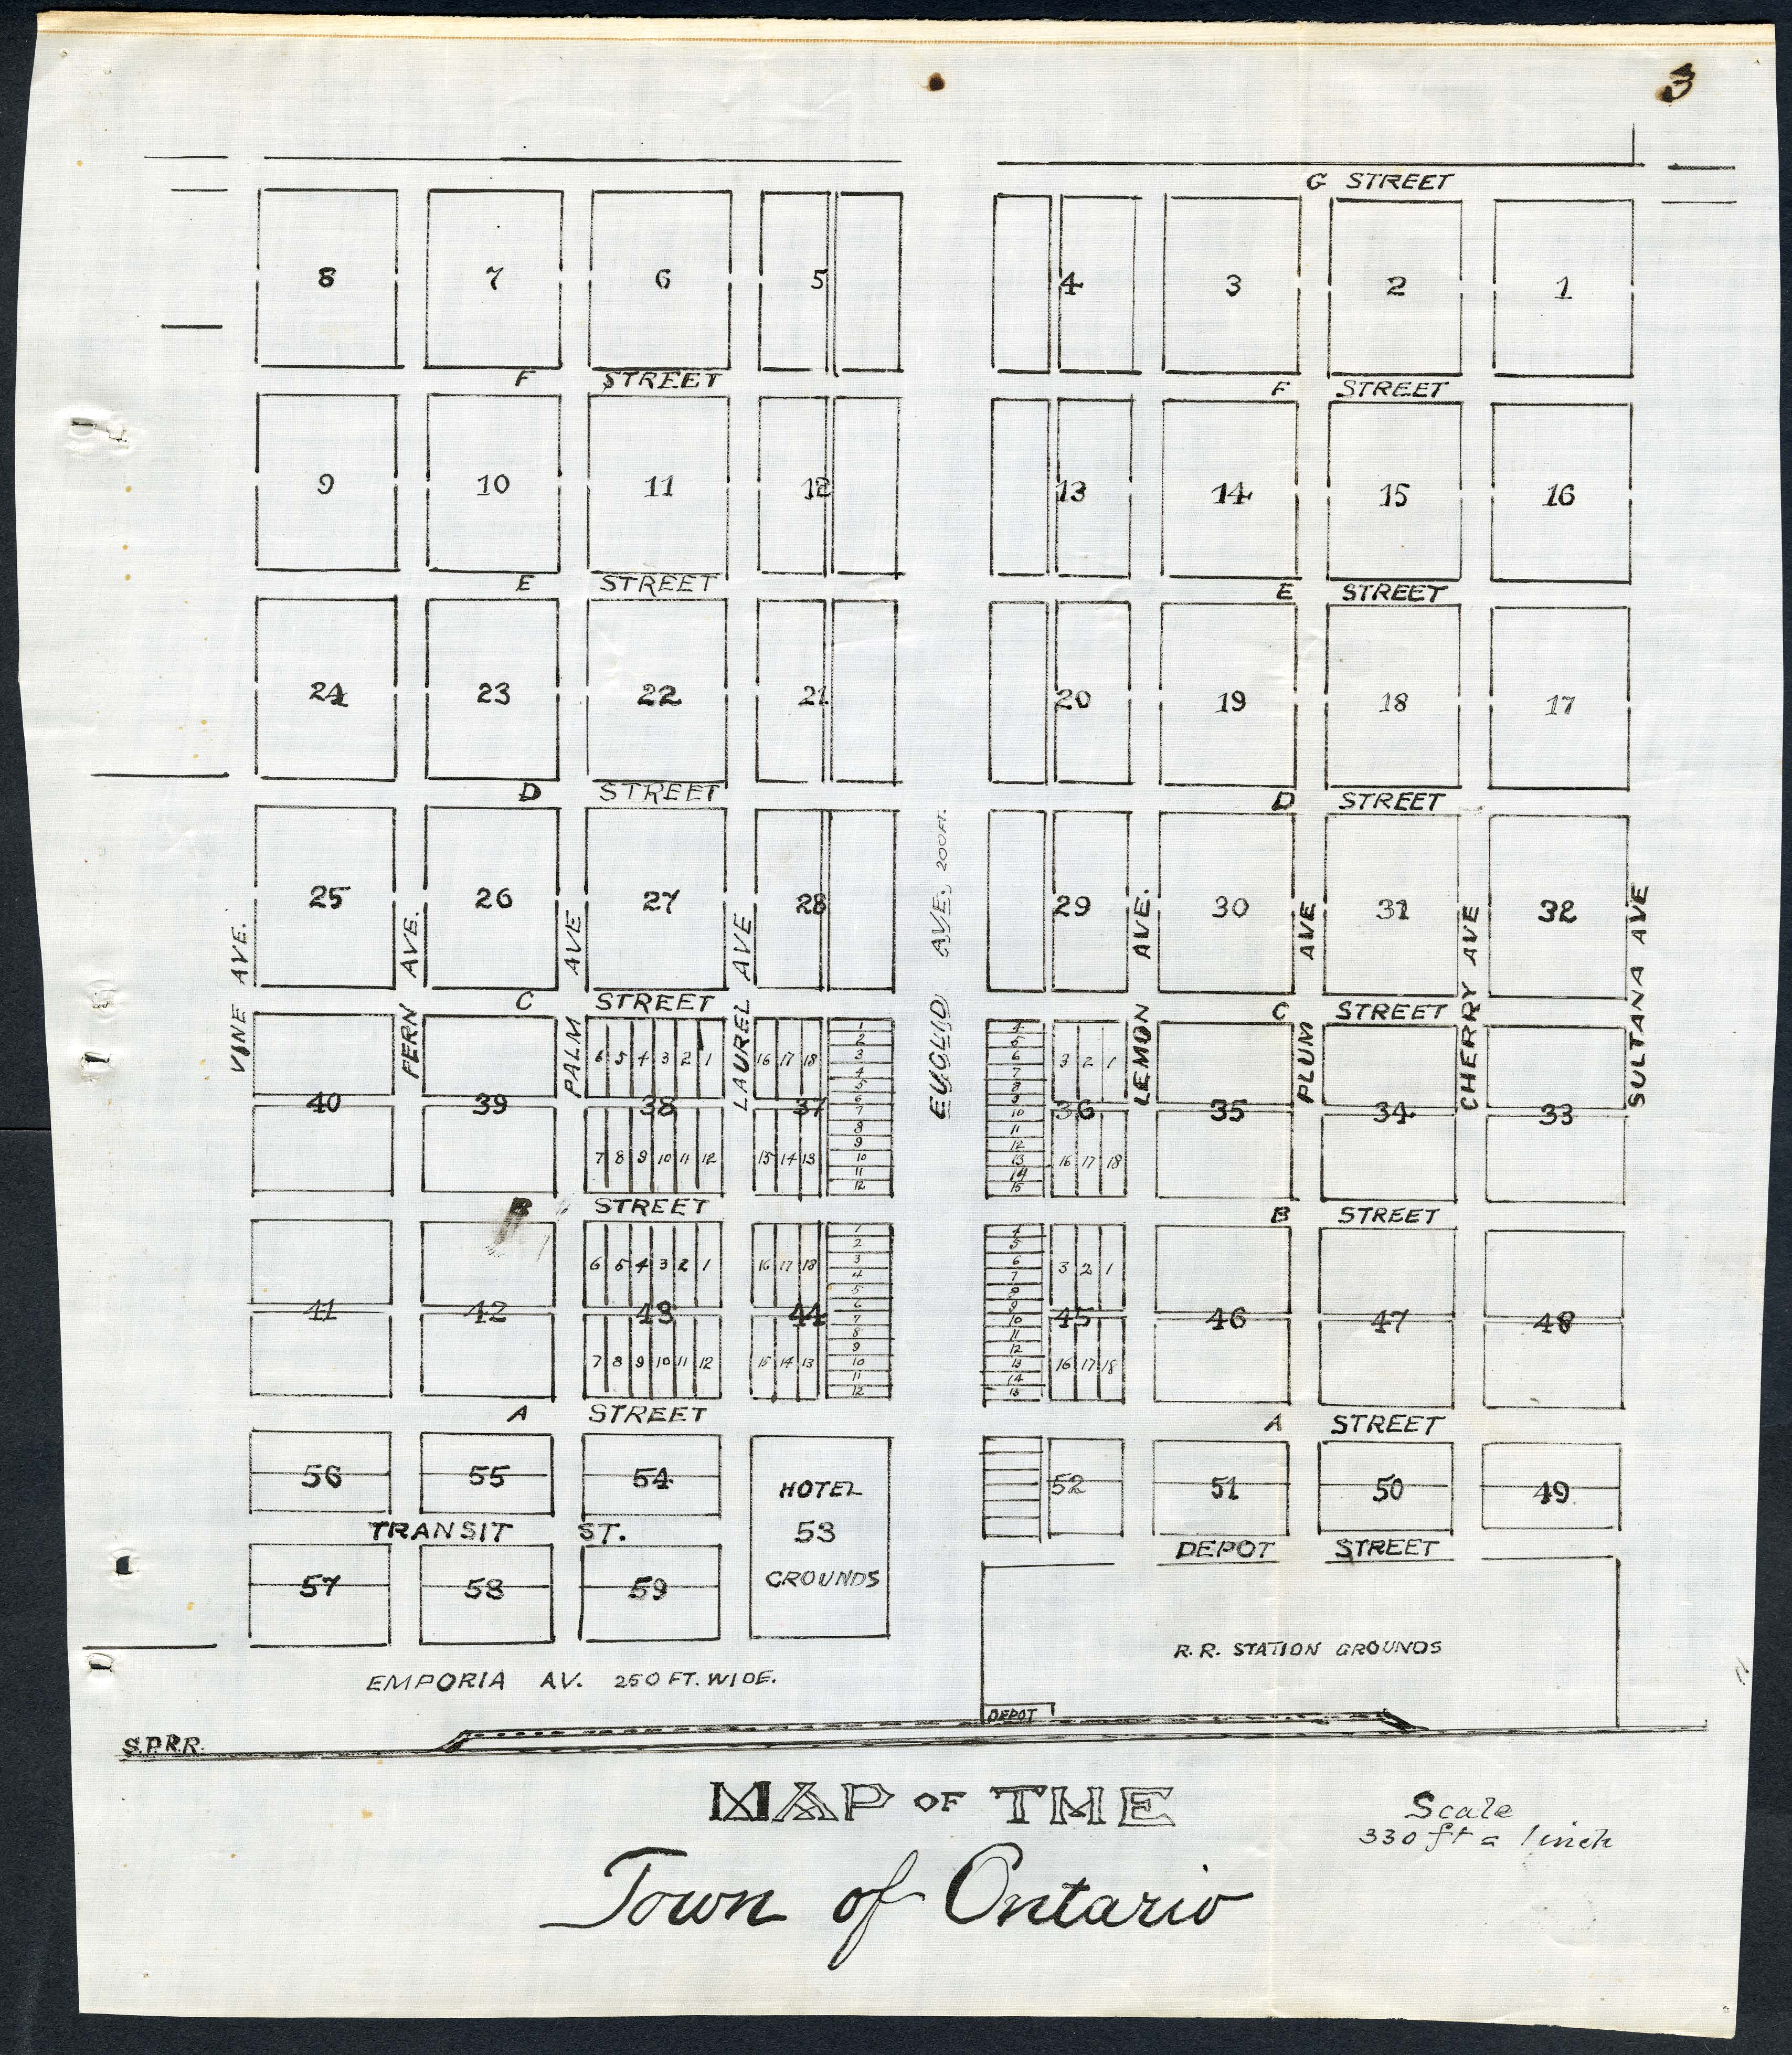
researchers. This week I came across a map of Ontario from the late nineteenth
century that intrigued me because I could imagine researchers using this map
to look at the development of Ontario, CA.
Map of Ontario.jpg

This map was made in 1883 and was found in a series of documents
pertaining to land and title companies in San Bernardino County during the late
nineteenth century.
 Map of Ontario Today.jpg

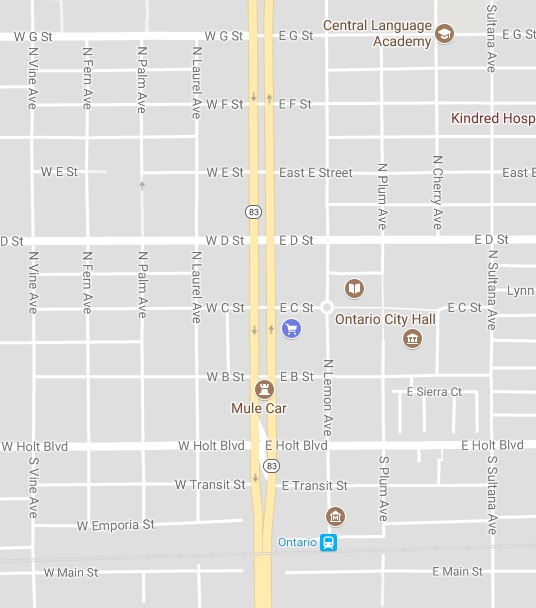
Although Ontario has changed a lot in the last 134 years,
some of the streets labeled on the map still exist today. I couldn’t resist
looking up this area of Ontario on Google Maps to see how things have changed.
 Map of Ontario Large.jpg

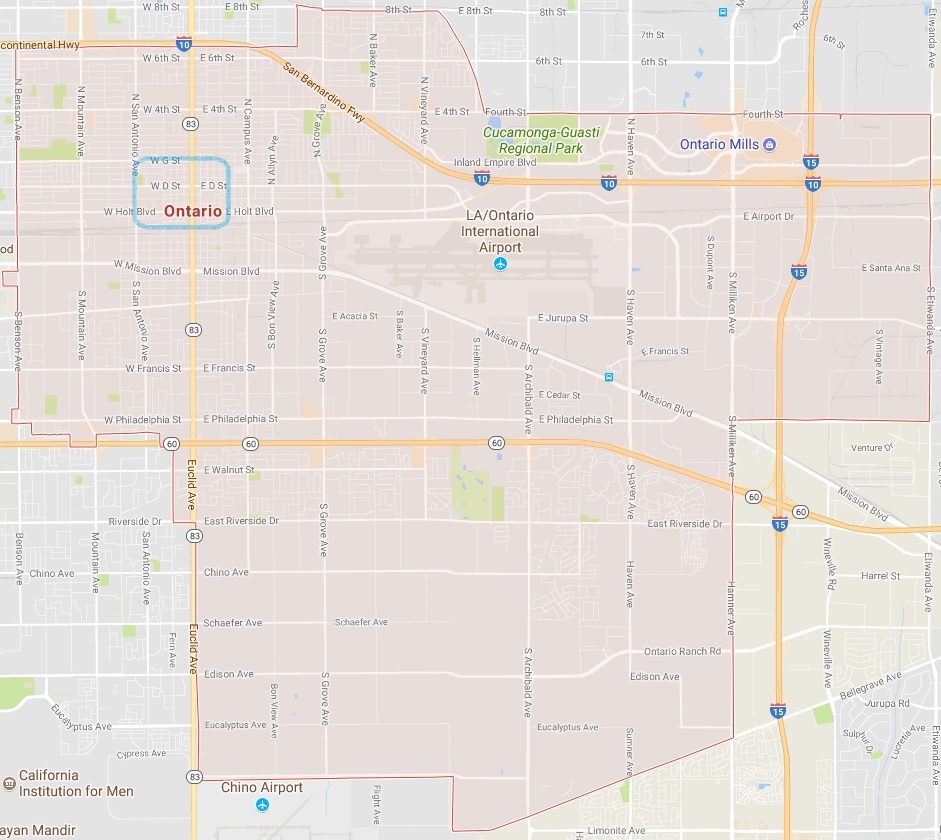
What is depicted on the map from 1883 is only a portion of
the Ontario of today. This is an image of the entirety of Ontario, CA, with a
blue box indicating the scope of the nineteenth century map.

Maps are some of the most interesting features I have come across during my time here, especially when I compare them to maps of today. Maps represent tangible evidence of how a place has changed throughout history and it gives a visually striking impression on how times have changed.

Normal
0

false
false
false

EN-US
X-NONE
X-NONE

/* Style Definitions */
table.MsoNormalTable
{mso-style-name:”Table Normal”;
mso-tstyle-rowband-size:0;
mso-tstyle-colband-size:0;
mso-style-noshow:yes;
mso-style-priority:99;
mso-style-parent:””;
mso-padding-alt:0in 5.4pt 0in 5.4pt;
mso-para-margin-top:0in;
mso-para-margin-right:0in;
mso-para-margin-bottom:10.0pt;
mso-para-margin-left:0in;
line-height:115%;
mso-pagination:widow-orphan;
font-size:11.0pt;
font-family:”Calibri”,”sans-serif”;
mso-ascii-font-family:Calibri;
mso-ascii-theme-font:minor-latin;
mso-hansi-font-family:Calibri;
mso-hansi-theme-font:minor-latin;}